
Fundamental Analysis in Trading: How to Evaluate Cryptocurrencies
A simple guide to crypto fundamental analysis: key metrics, project evaluation, and signs of reliability.
2025-11-07
Authorization is required only to use the service «Team energy»
Enter the e-mail you provided during registration and we will send you instructions on how to reset your password.
An error occurred while processing your request. Please try again later. If the problem persists, please contact our support team.
Learn the basics of crypto technical analysis: charts, levels, indicators, and entry points. Understand the market and act without emotions.
After mastering risk management, a trader needs to learn how to make entry and exit decisions. Technical analysis of cryptocurrencies helps you spot patterns on charts and assess market behavior without guesswork.
In this article you will learn:
According to Binance Academy, more than 75 percent of professional traders use elements of technical analysis even in fundamental strategies. It is a universal tool that helps you navigate any phase of the market.
Technical analysis is based on a simple idea: the market reflects everything that is happening. Expectations, news, and participants’ emotions are already priced in. Therefore, the chart shows not random fluctuations but the history of decisions made by the majority of traders.
Unlike the fundamental approach, which evaluates projects, partnerships, and tokenomics, technical analysis of cryptocurrencies shows the real-time reaction of market participants. According to CoinGecko, more than 60 percent of crypto traders make decisions guided specifically by levels and indicators.
This is logical: the crypto market trades around the clock, and data is updated every second. There are no quarterly reports here, but there is transparent trade statistics. Technical analysis helps you see probabilities. It does not promise an exact forecast, but it gives a structure within which each move can be explained. For the crypto market, where volatility often exceeds 10% per day, this is especially important.
A candlestick chart in trading shows the balance of power between buyers and sellers. Each candle consists of a body and wicks. The body reflects the difference between the open and close, and the wicks mark the minimum and maximum values for the selected period.
It is important for a beginner to understand how to recognize market direction. To do this, compare the sequence of highs and lows and assess where candles are closing. A bullish candle indicates a price increase, while a bearish one shows a decline. When a series of consecutive candles appears on the chart, they form patterns that can indicate market sentiment.
It is useful to remember that daily and weekly charts help you see the overall direction of price movement. Hourly and minute charts are convenient for finding short-term entry points. A candle close above resistance confirms a breakout, while long wicks indicate a standoff between large participants.
When analyzing the BTC/USDT pair, the average range of a daily candle exceeds 3%, and intraday fluctuations can reach 6%. Therefore, small moves should not affect the overall trading plan. On highly liquid exchanges, such as Binance or OKX, trading volume affects candlestick shapes. If price changes quickly but volumes remain low, this may indicate a false breakout.
Identifying the trend is considered the foundation of any cryptocurrency chart analysis. An uptrend forms when each peak becomes higher than the previous one, and a downtrend appears when lows gradually decline. For convenience, use trendlines that connect successive extremes.
How to work with levels:
This approach helps you see the trend and support levels, as well as understand where to enter and where to lock in results. CoinGlass statistics show that 68% of breakouts are followed by a return to the level before the move continues. Therefore, it is important not to rush into a trade immediately after an impulse.
To determine direction more precisely, use crypto moving averages (MA) with different periods. When a short moving average crosses a long one from below, it is considered a sign of an uptrend.
Indicators are mathematical tools that help determine the strength and direction of price movement. In crypto trading, RSI, MACD, moving averages (MA), and trading volume data are most commonly used.
RSI and MACD in simple terms:
Moving averages (MA) smooth fluctuations and show the overall direction of price movement. If price is above the 200-day MA, the market can be considered bullish; if it is below, the risk of decline increases.
Cryptocurrency trading volumes help confirm signal strength, since a breakout without rising volume often turns out to be false.
Practical tips:
Research by Santiment shows that combining RSI with volume increases the accuracy of identifying local BTC reversals to 65%.
Technical analysis patterns help you understand market participants’ behavior and determine the likely direction of price movement. These visual models repeat across different assets and timeframes, reflecting typical trader reactions to changes in supply and demand.
Examples of patterns:
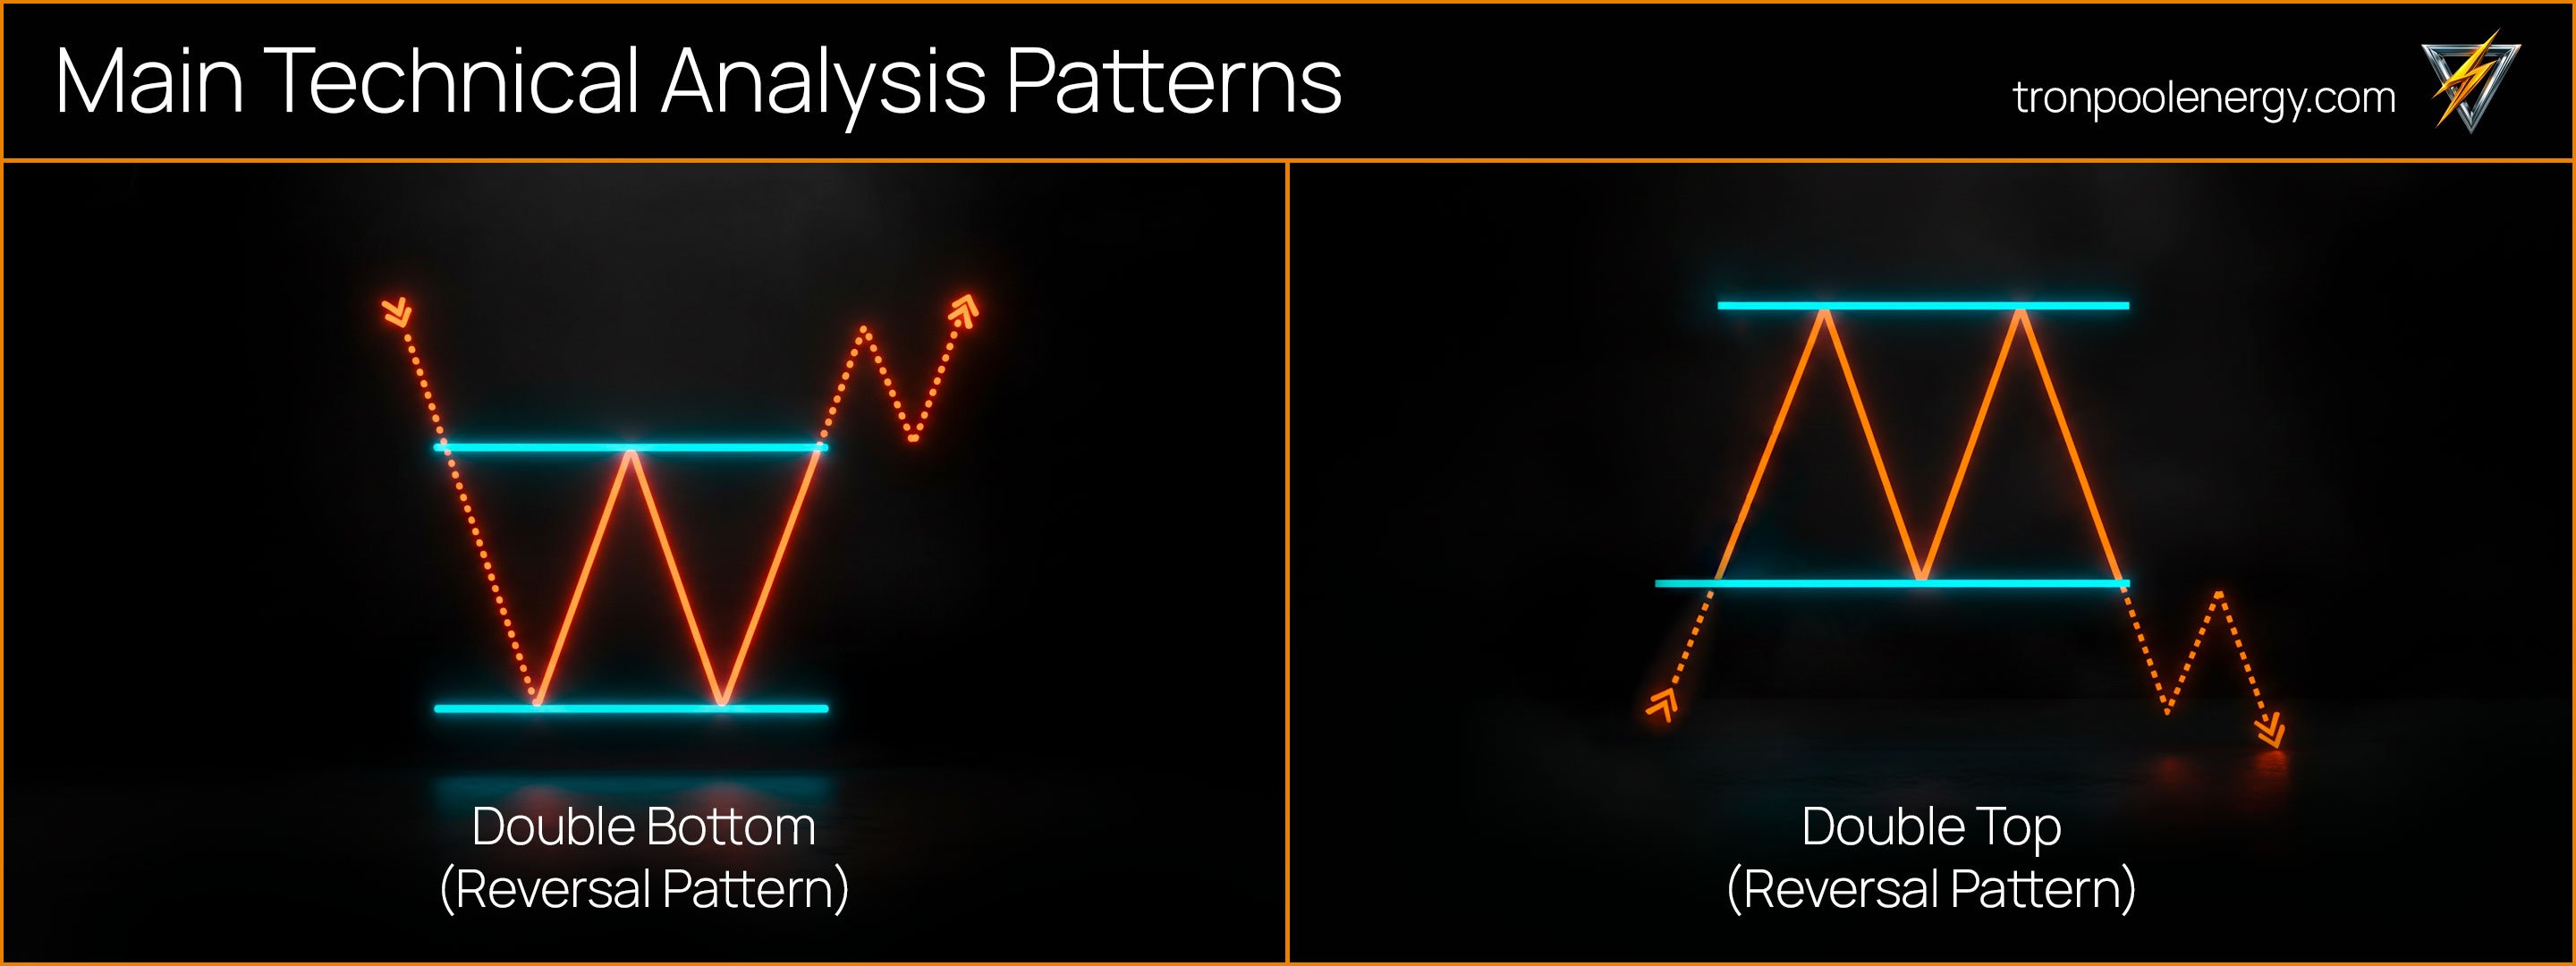
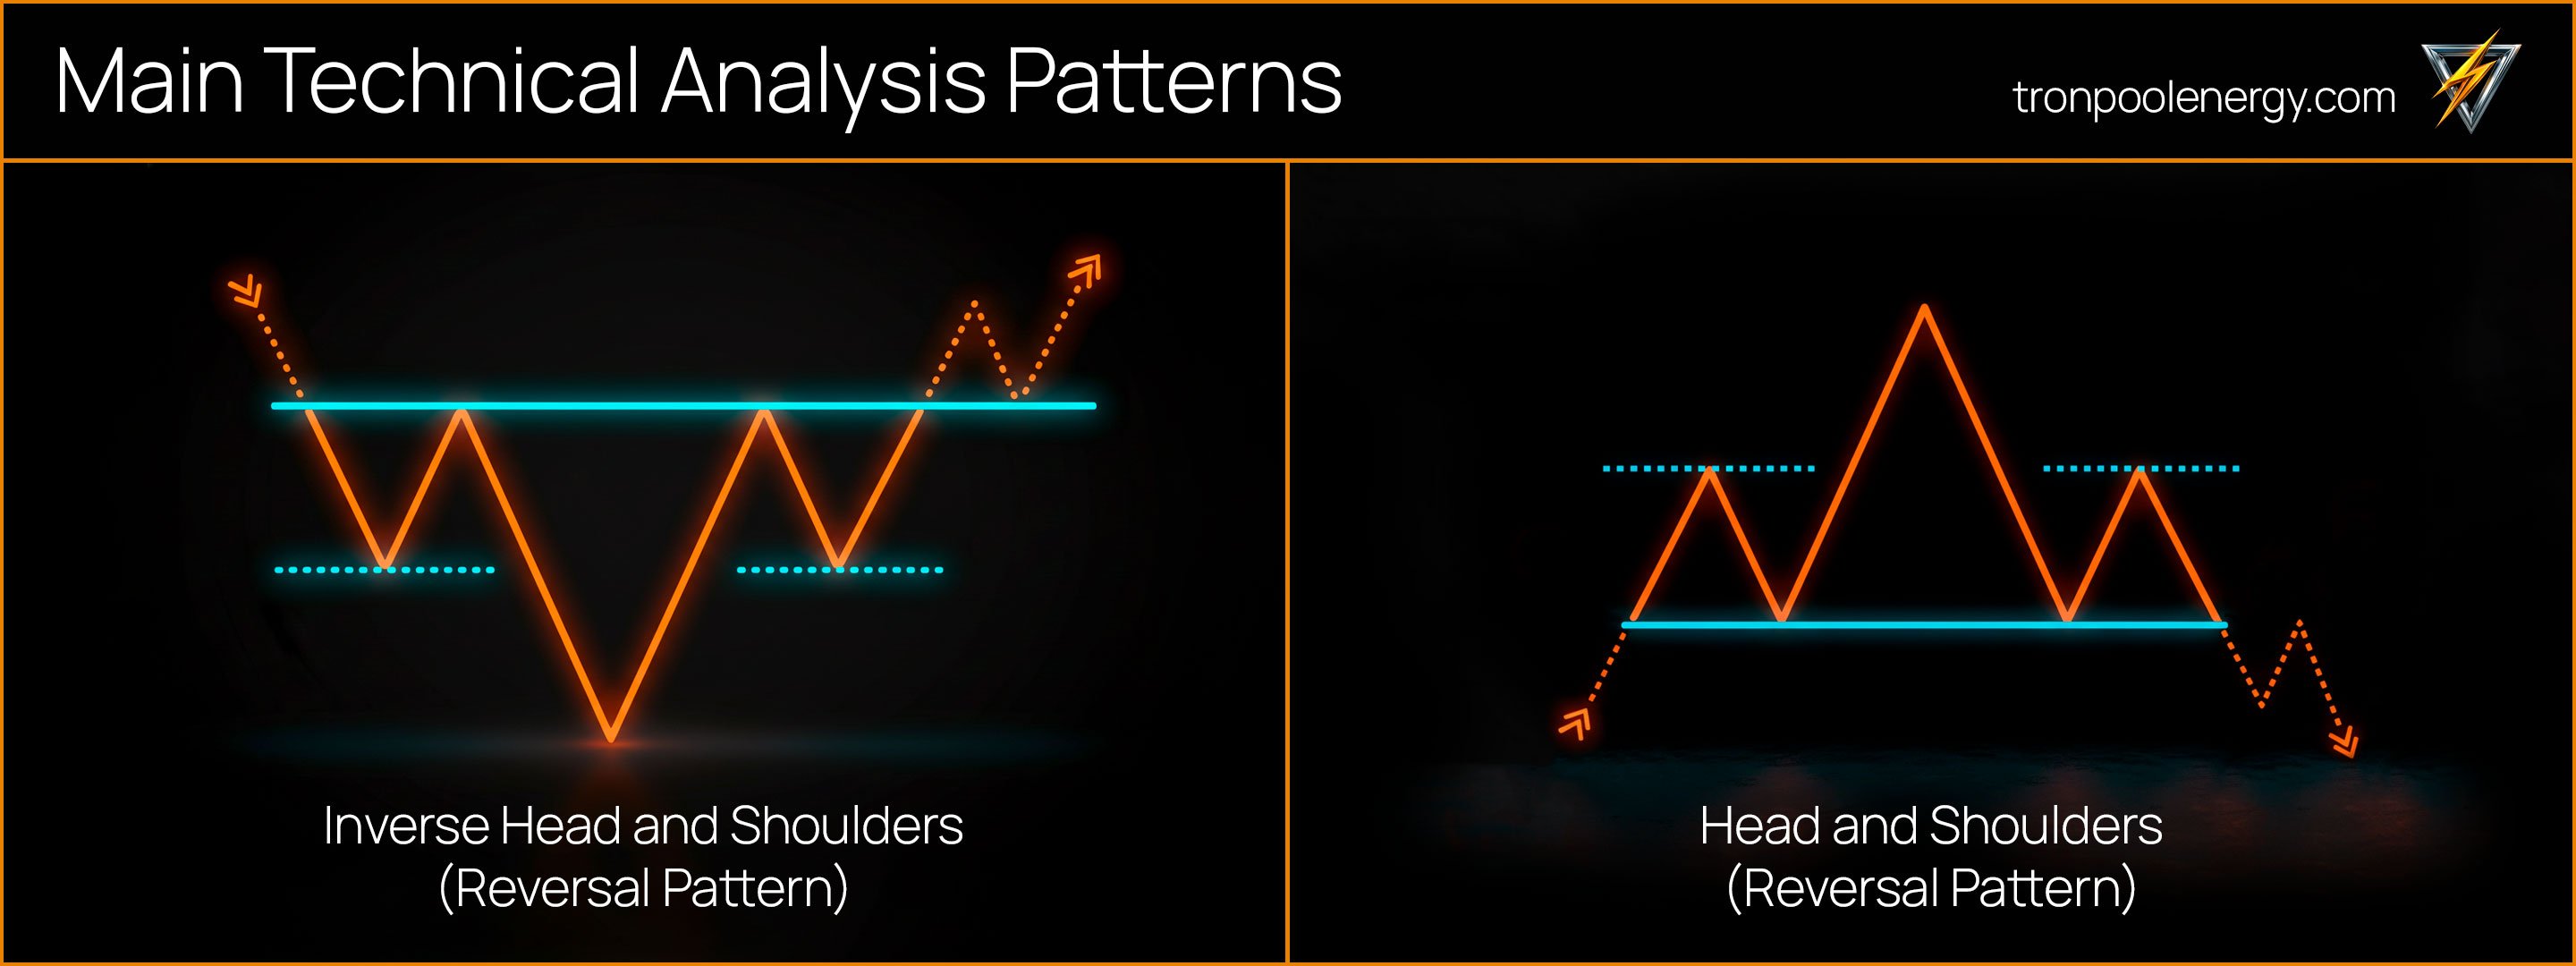
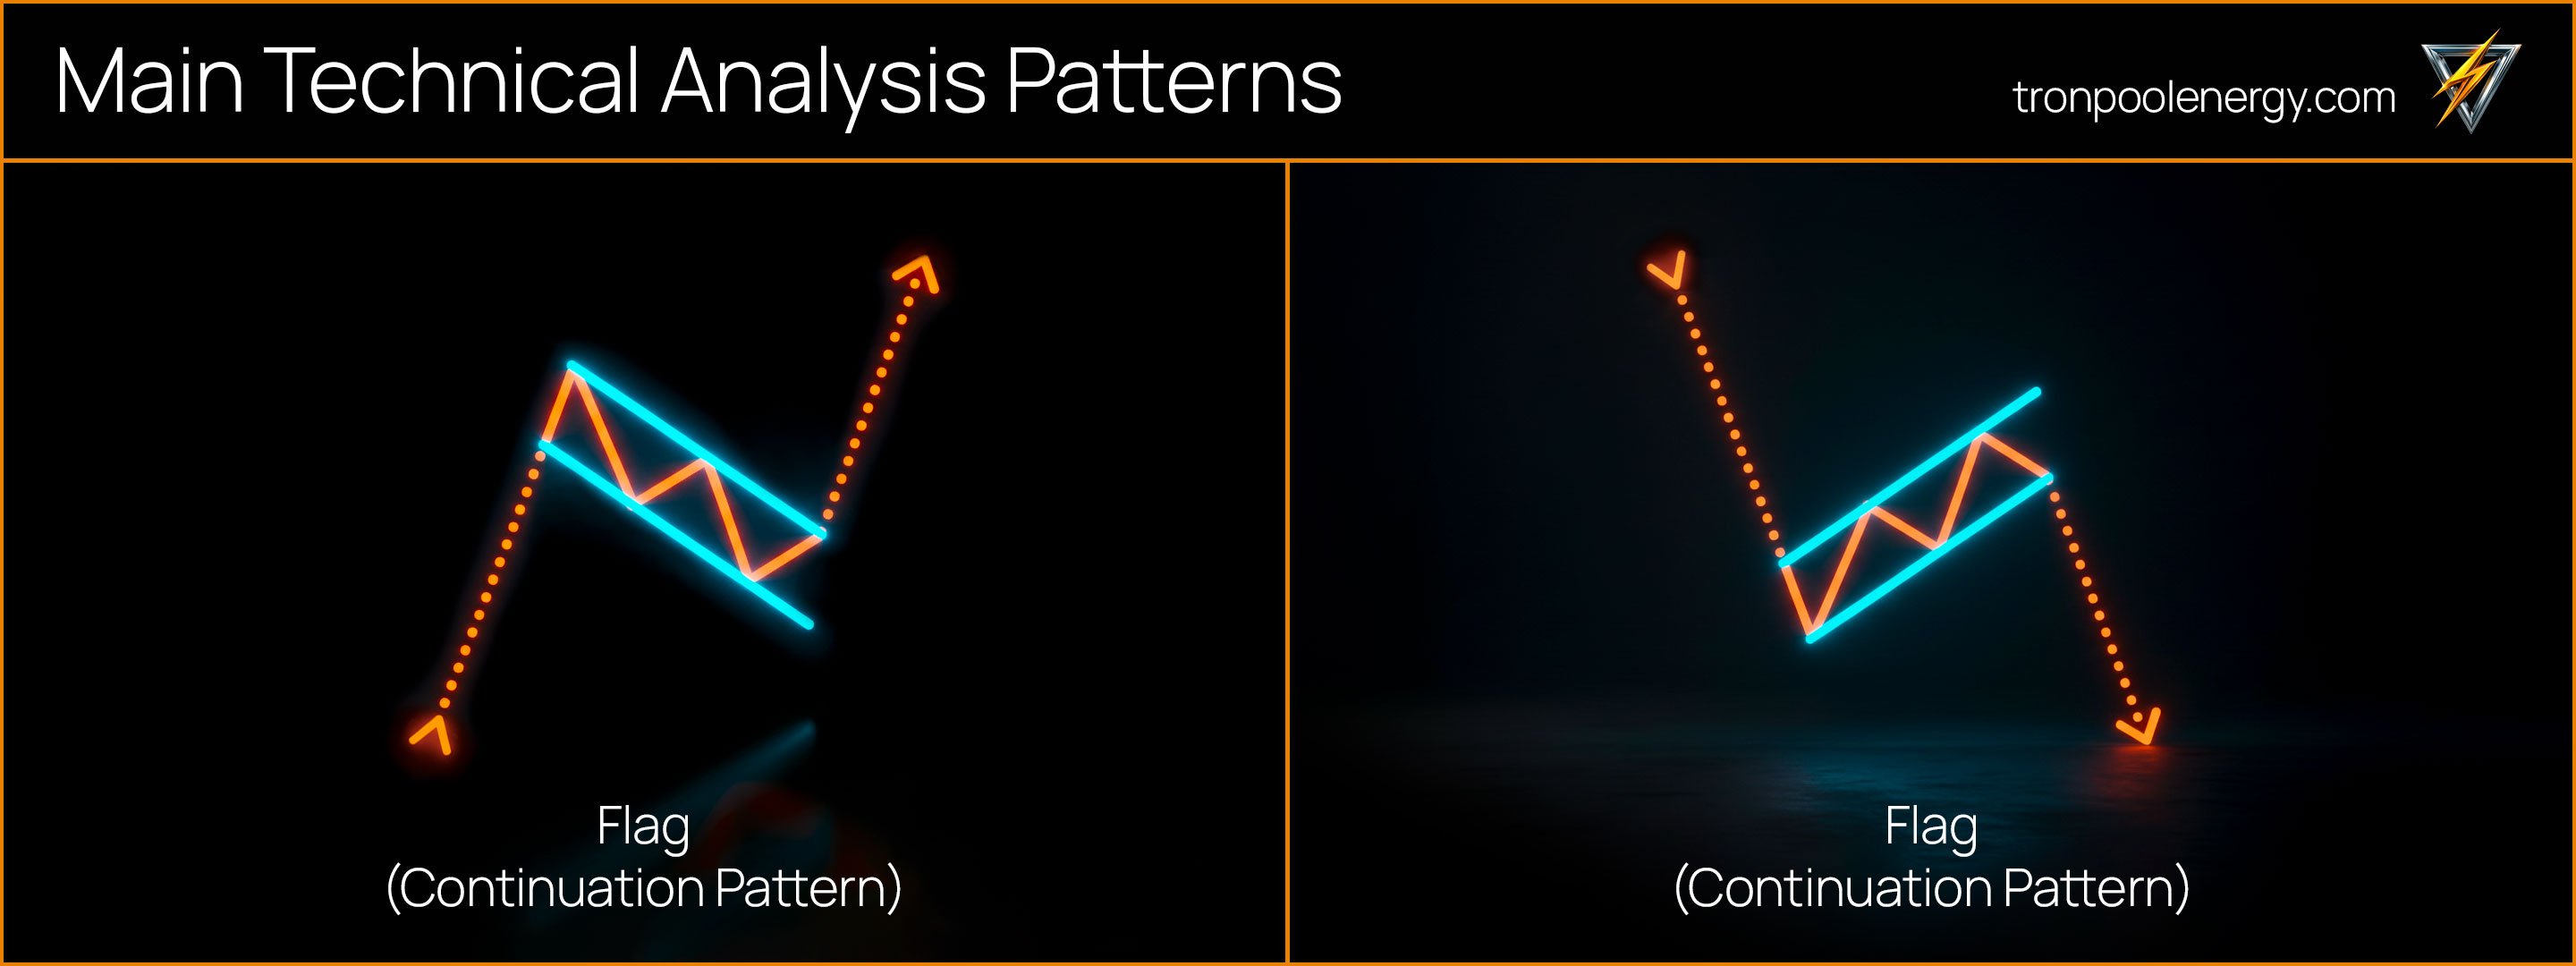
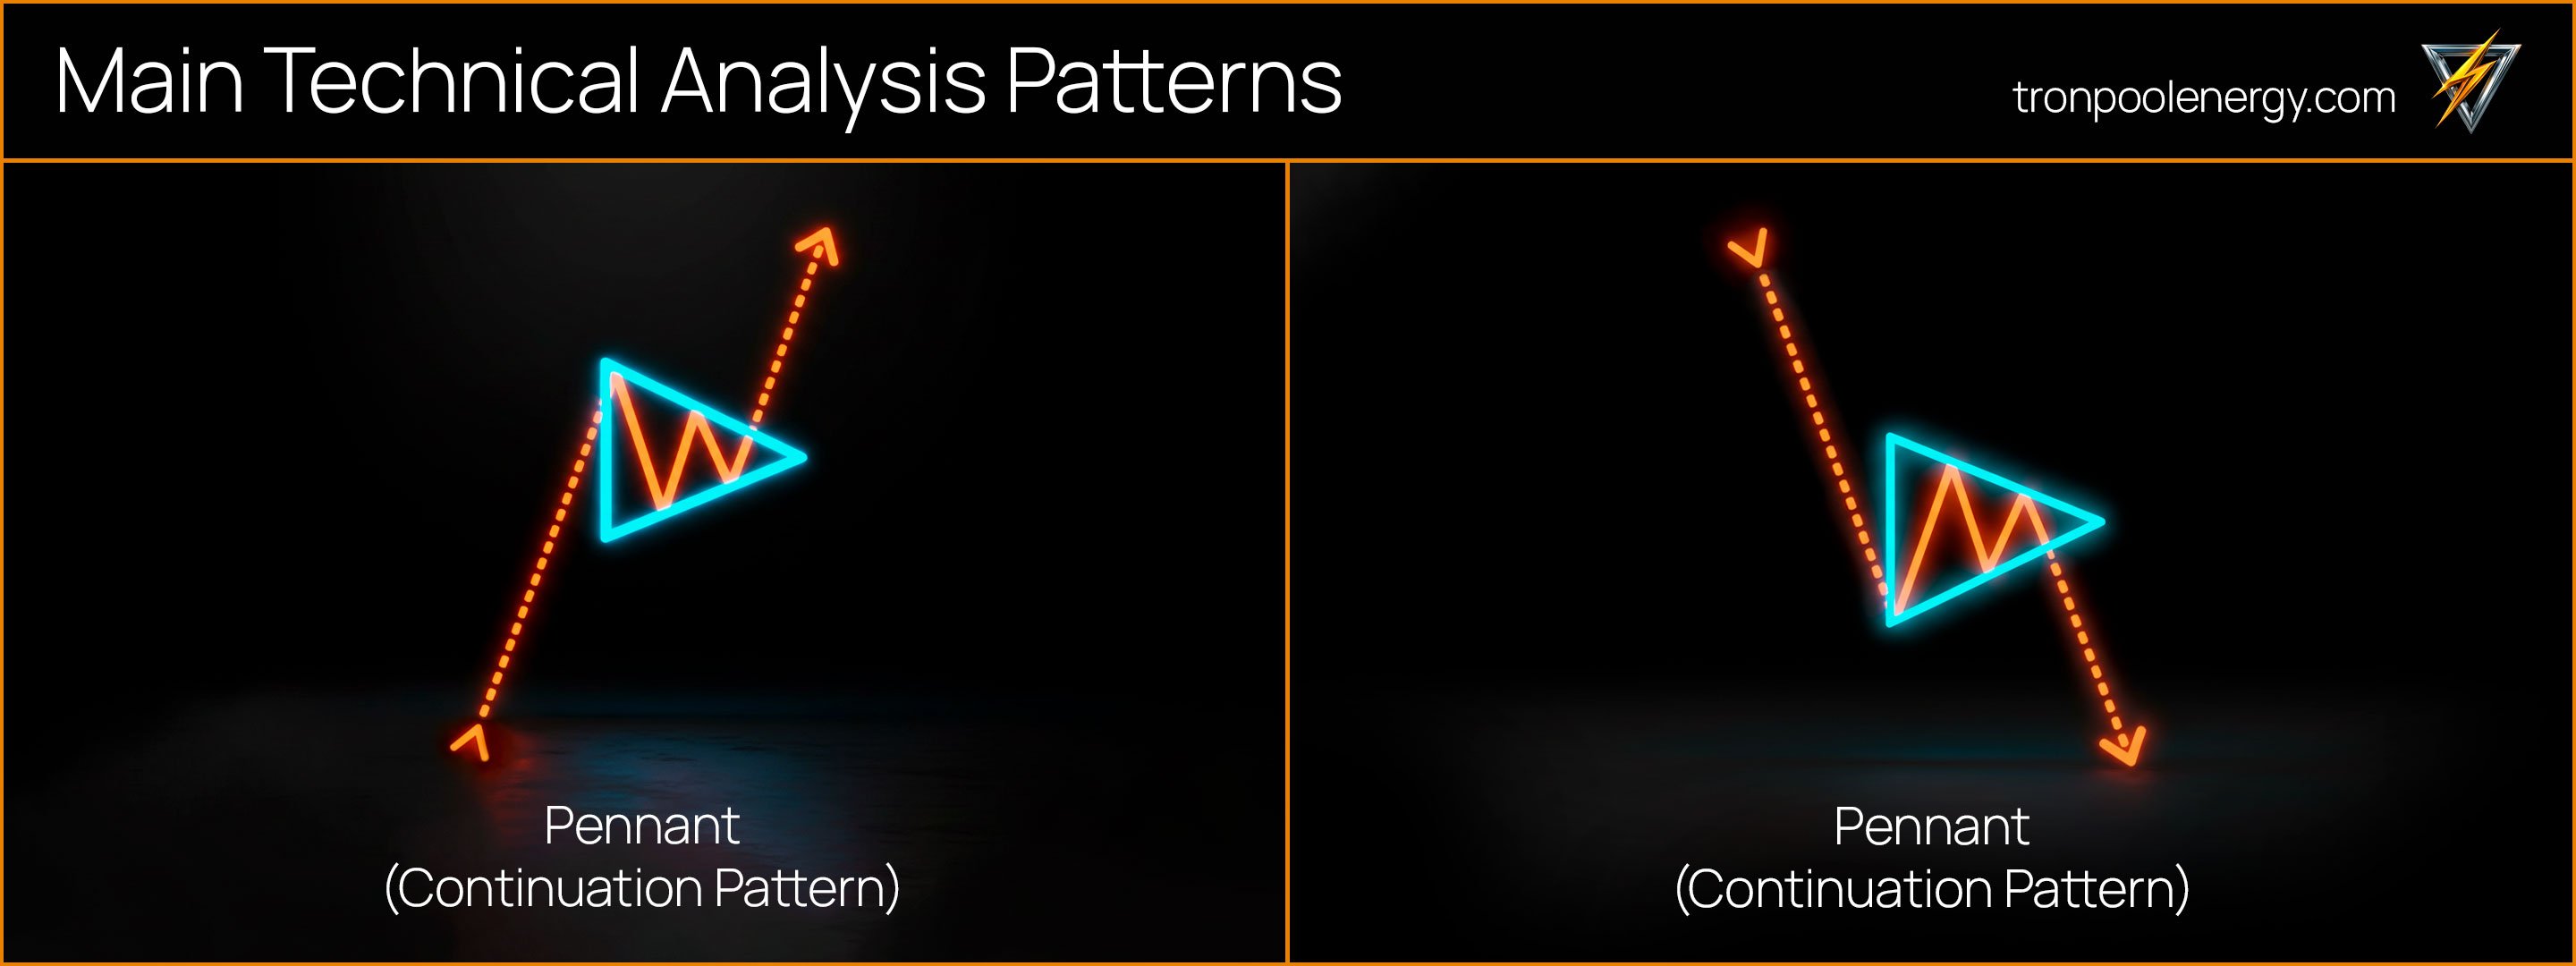
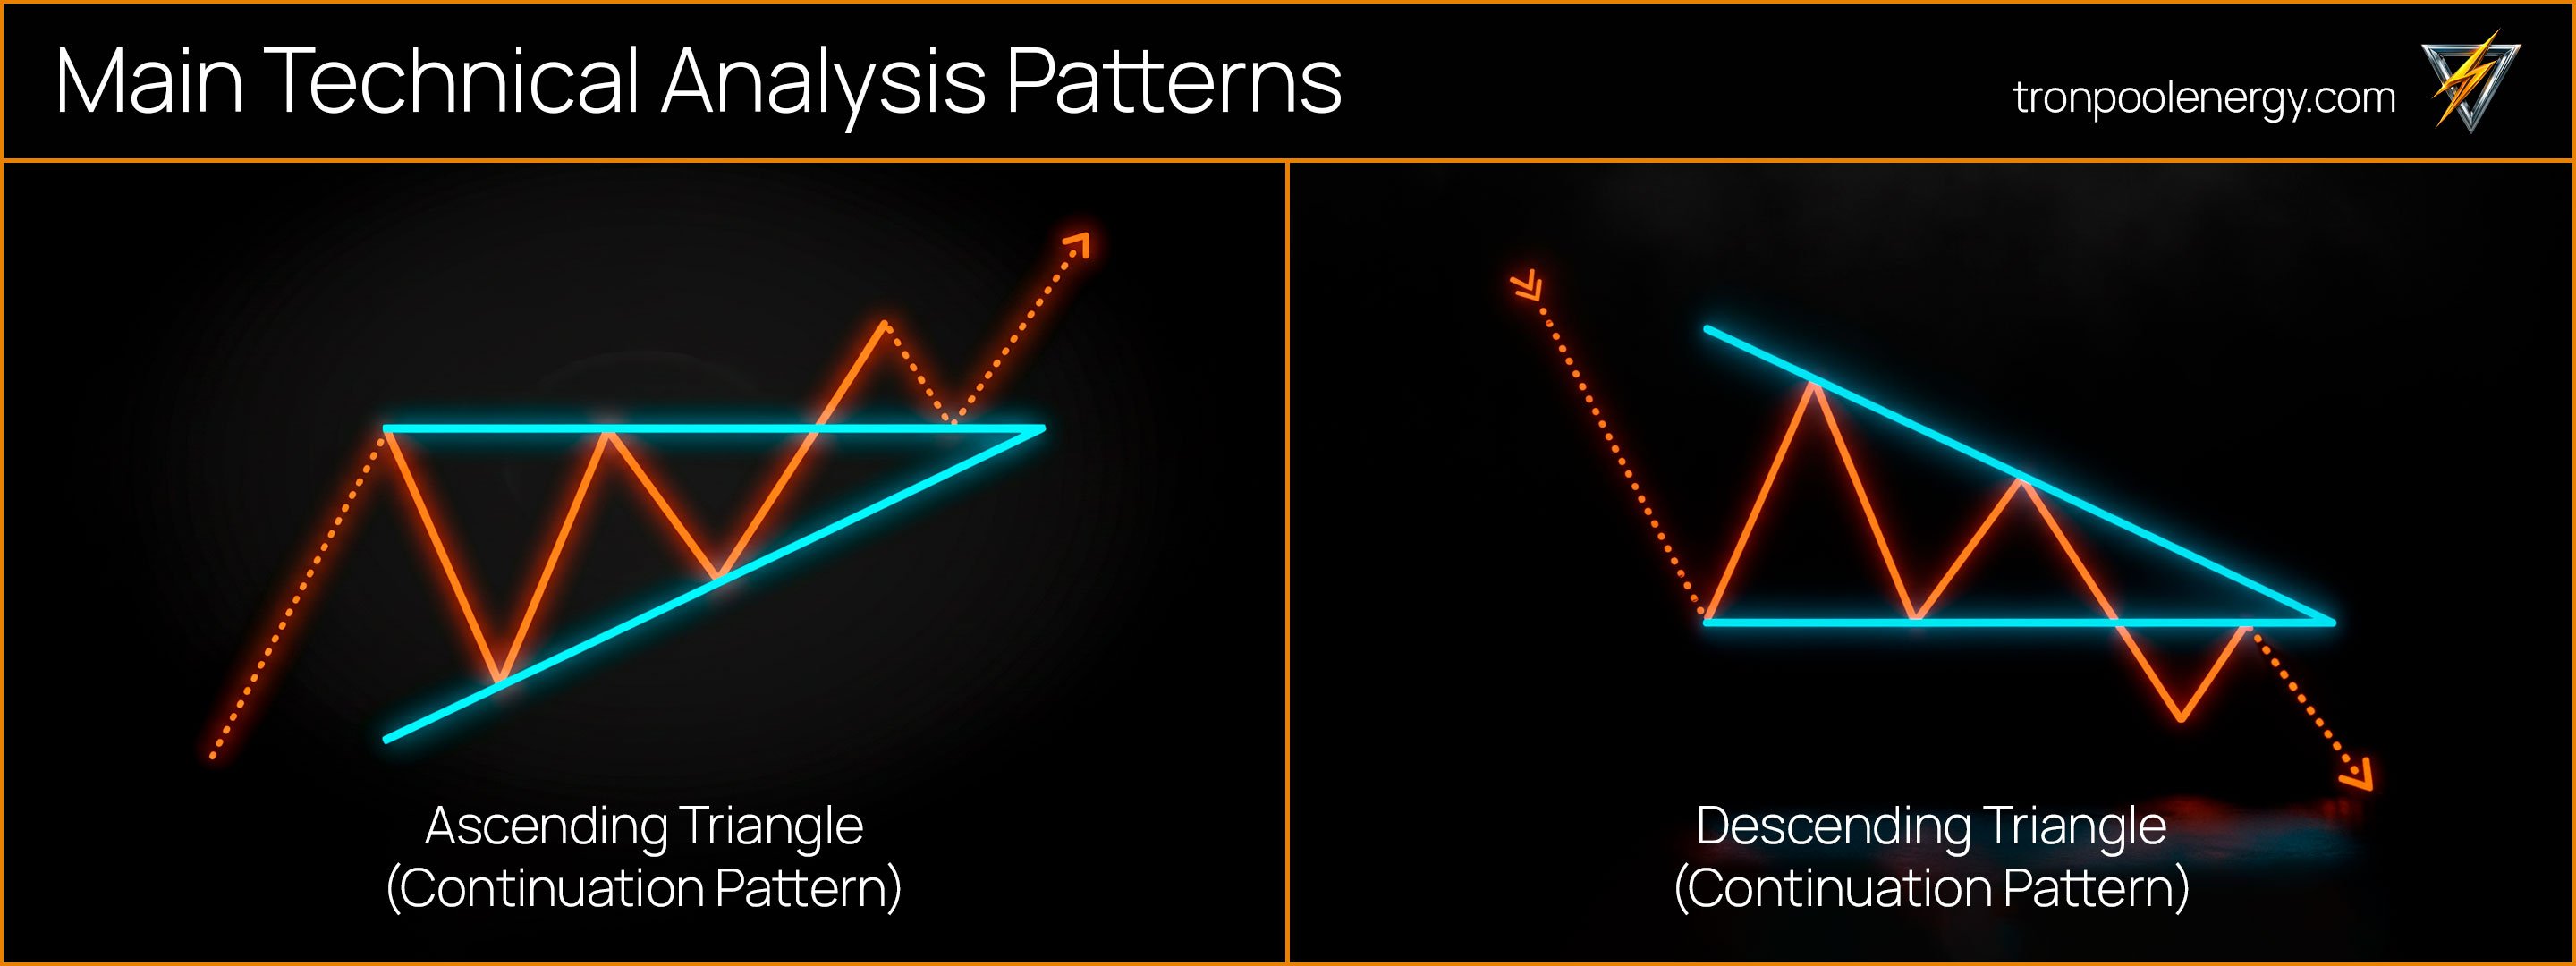
To avoid false entries, it is important to consider the broader market context. A pattern forming near a strong resistance level or around a news event may be unreliable. At the same time, if a pattern appears in the middle of a steady trend and is confirmed by RSI or MACD, the probability of successful follow-through is significantly higher.
Technical analysis of cryptocurrencies always requires confirmation by volume, because volume shows the real strength of a move and helps distinguish a true breakout from a short-term spike.
A good trade starts not with intuition but with signal confirmation. Experienced traders open positions only when there is a set of signs confirming the direction. The mistake most beginners make is trading on emotions rather than on data.
A reliable entry point forms after a retest of a level, when price checks a support or resistance zone and the signal is confirmed by RSI or volume. Additional confidence comes from the confluence of several indicators, for example RSI and MACD. For detailed rules on calculating risk, see the previous article in the series, Risk management: how not to lose your deposit.
Step-by-step algorithm for determining entries and exits:
For example, with a 1,000 USDT deposit and a 2% risk, the stop-loss should be 20 USDT. If the potential profit to the take-profit is less than 40 USDT, it is better not to open the trade. This set of rules forms a TA-based strategy in which each trade relies on levels, signals, and a pre-calculated risk.
Even the most accurate model loses its meaning if a trader does not maintain discipline and does not control risk. According to Bitget Academy, more than seventy percent of beginners lose their deposit specifically due to repeated mistakes in applying technical analysis. Most of these are not about the tools themselves but about the lack of a systematic approach.
Common mistakes traders make when analyzing charts:
These mistakes may seem minor, but they most often lead to losses. The cryptocurrency market is especially sensitive to news and the actions of large participants, so sharp moves occur even without fundamental reasons.
For example, during the release of FOMC decisions or U.S. labor market reports, the bitcoin price can swing by 6–8% in just an hour. Such spikes often “wipe out” positions of those who set their stop-loss too close or entered without confirming the signal. Therefore, it is important to remember that technical analysis does not guarantee a result; it only increases the probability of success if discipline and clear risk management are in place.
When the technical picture is clear, it becomes easier to build crypto market analysis, link local signals with the overall dynamics, and plan trades. Technical analysis does not predict the market; it helps you understand probabilities and see the structure of price movement.
Combined with risk management and capital management, it becomes a system rather than a gamble. Understanding how technical analysis works helps you notice chart logic, control risk, and make decisions without emotions.
The next article in the series is Fundamental analysis: how to evaluate projects and events. It explains how news, updates, and tokenomics affect coin prices and why this data complements technical analysis.
Technical analysis is a method of market evaluation based on charts and price history. It helps you find patterns and determine the likely direction of price movement. This approach allows a trader to make informed decisions based on data rather than emotions.
Each candle shows the open and close, as well as the high and low for the selected period. A green candle indicates price growth, while a red one indicates a decline. By closely observing the sequence of candles, you can understand who controls the market—buyers or sellers.
The RSI indicator helps determine whether an asset is overbought or oversold. When its value rises above 70, it signals a possible correction; when it drops below 30, growth may begin. The MACD indicator shows a change in momentum, and the crossing of its lines often indicates the start of a new trend.
A trend is defined by the direction of highs and lows. If each high and low is higher than the previous one, this is an uptrend; if they are lower, a downtrend is observed. To refine direction, use moving averages, which smooth out price fluctuations.
A support level marks an area where price often halts its decline, while a resistance level marks a zone where growth slows. These levels are formed by traders closing trades or opening new positions. When price breaks one of the levels, it usually indicates a shift in the balance between buyers and sellers.
An entry point is found after signal confirmation, for example during a retest of a level or when RSI and MACD signals align. Before opening a trade, it is important to calculate the risk-to-reward ratio. You should also set a stop-loss and take-profit in advance so trading remains controlled.
Patterns can indeed be effective, but their performance depends on context, volume, and the current trend. They do not guarantee success; they only increase the probability of making the right decision. To avoid false signals, patterns should be confirmed by indicators and volume analysis.