Trading Strategies for Traders: From Scalping to Swing
Explore key crypto trading strategies — scalping, day, swing, and position trading. Learn how to choose the right approach for your experience.
2025-11-07
Authorization is required only to use the service «Team energy»
Enter the e-mail you provided during registration and we will send you instructions on how to reset your password.
An error occurred while processing your request. Please try again later. If the problem persists, please contact our support team.
TradingView helps traders spot levels, identify trends, set alerts, and catch strong entry points. Here’s how to use charts for real trades.
TradingView is considered the gold standard among tools for technical analysis. Both beginners and large funds use this platform. It’s not just a site with charts but a full-fledged analytical environment where it’s convenient to watch price action, draw trend lines, and track market sentiment. Even if a person doesn’t trade, TV helps them better understand what’s happening with assets.
In this article you will learn:
TradingView is much more than just a platform. It’s a handy map-helper for those who want to understand how the market works and learn to navigate it. If you’re looking for TradingView for beginners, this material will help you take the first steps and confidently master all the basics.
TradingView is an online platform where you can view prices and trading volumes from different exchanges in the form of intuitive charts. The user sees quotes, volume data, indicators, news, and traders’ ideas from around the world. This format helps you quickly grasp overall market sentiment and assess current trends.
Data comes from the largest venues, including Binance, OKX, and Bybit. Thanks to this, a live cryptocurrency chart is displayed on the screen, updating almost in real time. The delay depends on the exchange and the data provider.
The platform runs in a browser, is available as a mobile and desktop app, and is embedded into many sites, for example CoinMarketCap and exchange dashboards. The interface stays the same across devices, so switching between them is easy.
TV adapts quickly to the user. You can change assets and timeframes, add indicators, save analysis templates, and sync them across devices. This approach makes working with TradingView clear and convenient even for those just beginning to explore the platform.

The first thing to start with when setting up a tradingview chart is choosing an asset. In the top search bar, enter a ticker, for example usdt trx tradingview, and choose the desired exchange. Prices vary slightly across venues, so it’s better to stick with the one you usually trade on.
After that, set a timeframe — 1 minute, 15 minutes, 1 hour, 4 hours, 1 day, or 1 week. This parameter shows how detailed the price movement is and helps you choose a convenient scale for analysis.
Now choose a chart type:
Understanding these formats helps you figure out how to read crypto charts. With experience, you start to feel market structure more precisely and can determine direction even by candle color.

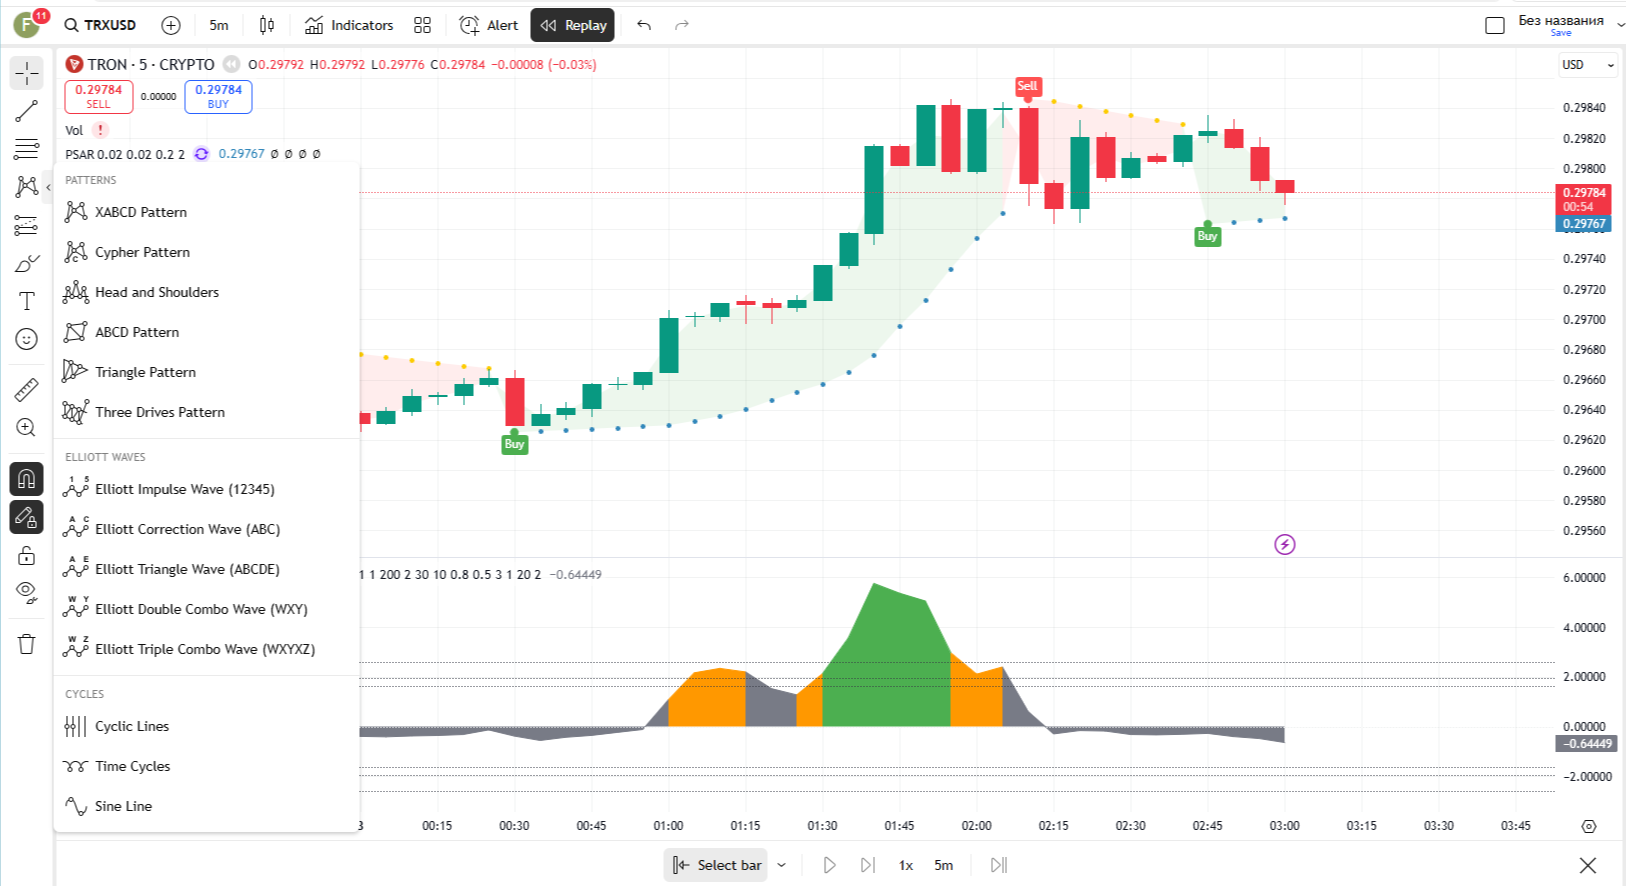
The left panel contains the main set of tools needed for visual analysis. Here you can draw lines, mark levels, measure moves, and add markup directly on the chart. These tools help you not just look at price, but understand how it moves and where key reversal points may appear.
The core tools look like this:
For example, if TRX rises from 0.10 to 0.12, the ruler will show a growth of approximately 20 percent. Trend lines will help identify where the move may pause, and the Fibonacci grid will suggest likely pullback zones.
In addition to drawing tools, there are extra features that often go unnoticed. For instance, you can enable “magnet mode” so lines automatically snap to candles and plot more precisely. It’s also useful to use the Rectangle tool to highlight accumulation or consolidation zones.
In the bottom-right corner you’ll find the time scale. You can drag it and zoom to examine the desired section of the chart, and double-click to return to the default view. These simple elements make working with TradingView as visual and convenient as possible, even for those just starting to learn analysis.

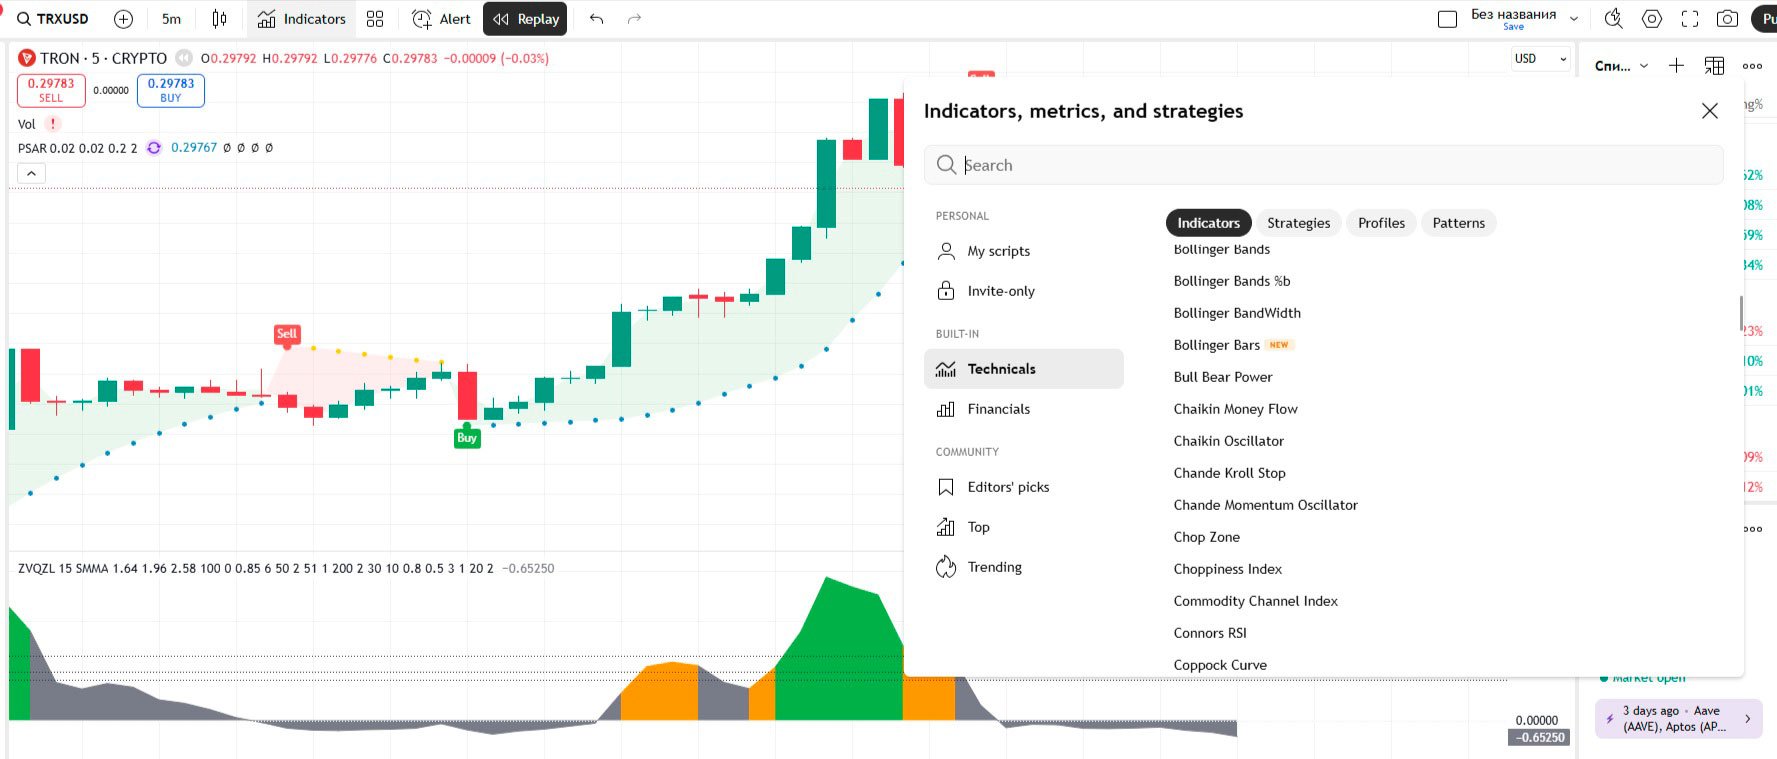
Indicators help you not just look at the chart but see the market’s hidden dynamics. They work like mathematical filters, turning ordinary price movement into clear signals and hints. To understand how to add an indicator, click the Indicators button on the top panel and enter the name of the tool you need. After that, the selected indicator will appear directly on the chart or beneath it, depending on the type.
Here are the most popular tradingview indicators to start with:
Beginners often use the rsi macd ma tradingview combination because it lets you view the market from three angles at once. MA helps grasp trend direction, MACD shows when the move loses strength, and RSI suggests whether the market has gone too far one way. This combo gives a balanced picture and suits even those just starting to study analysis.
Beyond these tools you can try Bollinger Bands, Stochastic, or EMA. They expand the set of signals and help filter out false moves.
You can add multiple indicators under the chart at the same time, change their colors, line thickness, and position. When the settings become convenient, it’s worth saving a template so you can reuse it without entering parameters manually. This saves time and stabilizes your analysis, especially if you work with multiple assets.


No tradingview guide would be complete without the ability to save your work. For this you need an account — even the free Basic plan will do.
What to master right away:
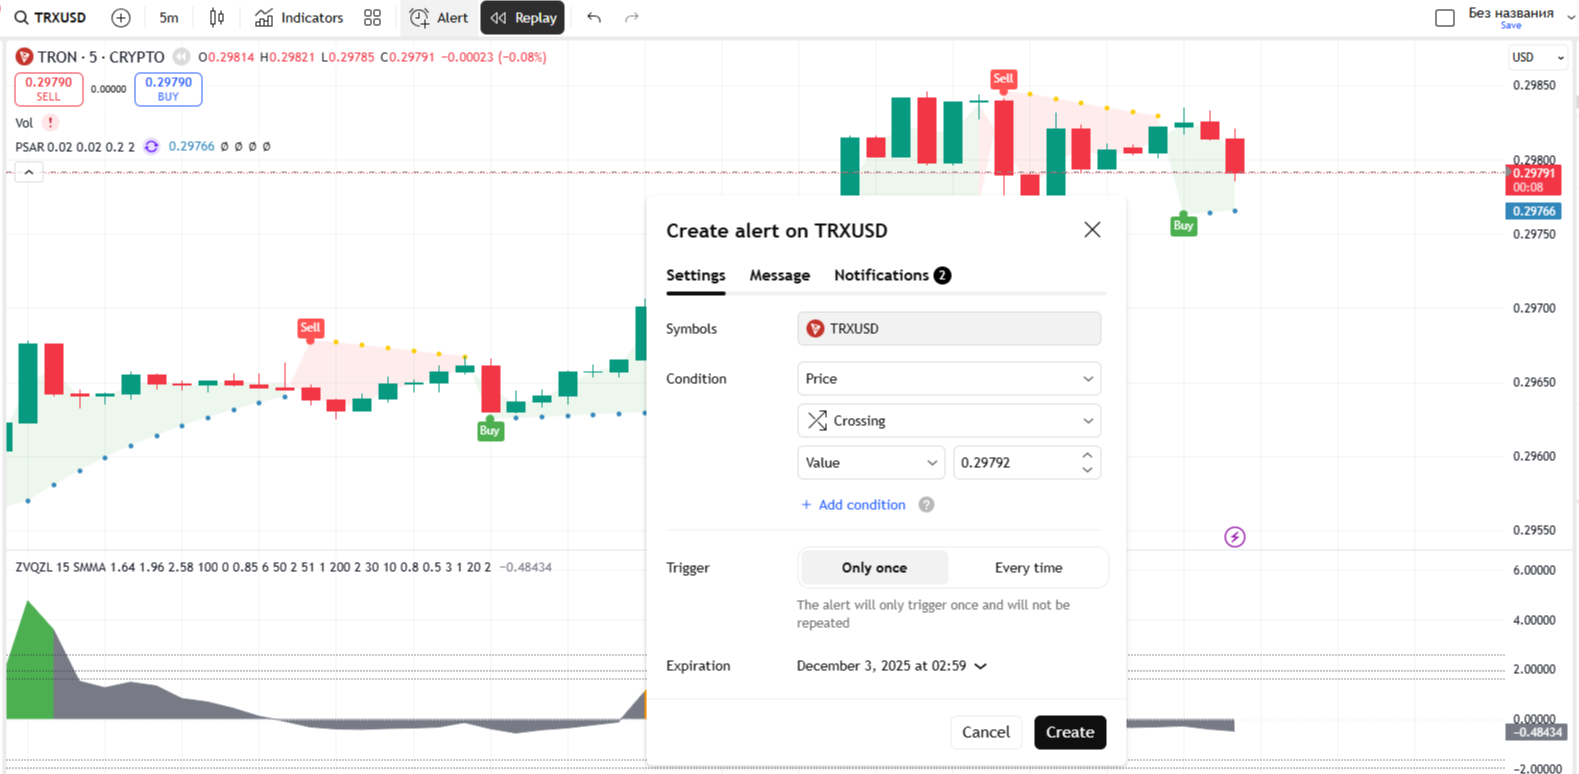
These features turn TV into a convenient personal analysis dashboard. You can set notifications to email or the mobile app and calmly follow moves without opening the chart.
It’s better to save templates under different names, for example “BTC daily” or “TRX short,” so it’s easier to find the right option and return to your analysis style.
The main advantage of TradingView is that the platform unites all the tools needed for analysis. Here it’s convenient to view charts, connect indicators, read other traders’ ideas, and track market news in one place. There’s no need to open multiple sites because all crypto analysis in TradingView happens in a single window.
You can study tradingview crypto charts like BTC/USDT and, if you wish, add a second pair to compare their movement. This helps you notice correlations between assets and find entry or exit points.
If you work with the TRON network, the platform is ideal for analyzing the TRX price. Just choose Binance, set the 4H timeframe, add RSI and MA — and you’ll see the token’s dynamics instantly.
For those who want to learn how to analyze in tradingview and understand the market systematically, this tool is ideal. Here you can test strategies, track price behavior, and visually notice moments when an asset is overheated or oversold.
Additionally, TradingView supports growth through the trader community. Users share their ideas and forecasts, comment on others’ charts, and discuss approaches to analysis. This ecosystem creates an environment for exchanging experience, where you can learn and improve without leaving the platform.

TradingView works for free on the Basic plan. This option gives full access to charts and core features but has a few limitations. A user can add only 2 indicators, create one alert, and will see ads. To start, this is more than enough to learn the platform and conduct basic analysis.
When your work becomes more active and you need more tools, you can consider other plans. Below is a brief comparison of plans to help you understand which option suits you best.
| Plan | Key differences from Basic |
|---|---|
| Basic (Free) | 2 indicators, 1 chart, 1 alert, ads present. |
| Essential | 5 indicators, 2 charts in 1 tab, 20 alerts, no ads. |
| Plus | 10 indicators, 4 charts in 1 tab, 100 alerts, data export. |
| Premium | 25 indicators, 8 charts in 1 tab, 400 alerts, 1-second intervals. |
| Ultimate | 50 indicators, 16 charts in 1 tab, 1000 alerts, tick intervals. |
Information is taken from the official TradingView Pricing page. For most users, the Basic plan’s capabilities are sufficient for a long time. However, if you work with several coins at once, want to use more indicators, or build more complex analysis schemes, it’s better to switch to Plus or Premium. These versions unlock additional features and make working with charts much more convenient.
TradingView remains the main tool for those who want to understand market movement. Knowing how to use tradingview helps you see real trends and make decisions instead of just watching the news.
On the platform it’s convenient to compare assets, test strategies, and track dynamics without risk. The service pairs perfectly with CoinMarketCap, where you can view market cap, and Tokenomist.ai, which shows the token unlocks calendar. Together they provide a complete and visual picture of the market.
Once you master the basics like selecting a timeframe and adding RSI, you’ll be able to conduct your own analysis confidently and understand the market more deeply. This material is for educational purposes and is not a trading or investment recommendation.
It’s like Google Maps, but for financial markets. It takes “raw” price data from exchanges and turns it into convenient interactive maps (charts). On these “maps” you can plot routes (trends), mark important points (levels), and use navigators (indicators) to understand where price might go next.
You enter the ticker of the coin you need (for example — BTCUSDT) in the search bar and choose an exchange (for example — Binance). Then you set a timeframe (for example — “1D” — 1 day) and add the indicators you need (for example — MA or RSI) via the Indicators button. Using the tools on the left, you can draw trend lines and support levels.
Click the Indicators button on the top toolbar. A search window will open where you can enter the name of the indicator you need, for example “RSI” or “Moving Average.” Click the name, and it will automatically appear on your chart.
You need an account (the free Basic plan is fine). After you’ve configured the chart, added indicators, and drawn lines, click the cloud icon in the top-right corner (Save Layout). You can also press Ctrl+S (or Cmd+S on Mac) to save changes.
The main differences are limits and ads. The free plan (Basic) shows ads, lets you open only 1 chart, and use no more than 2 indicators at the same time. Paid subscriptions (Essential, Plus, Premium) remove ads and lift these limits “in layers”: they give more indicators, allow multiple charts in one window, and let you set hundreds of alerts.
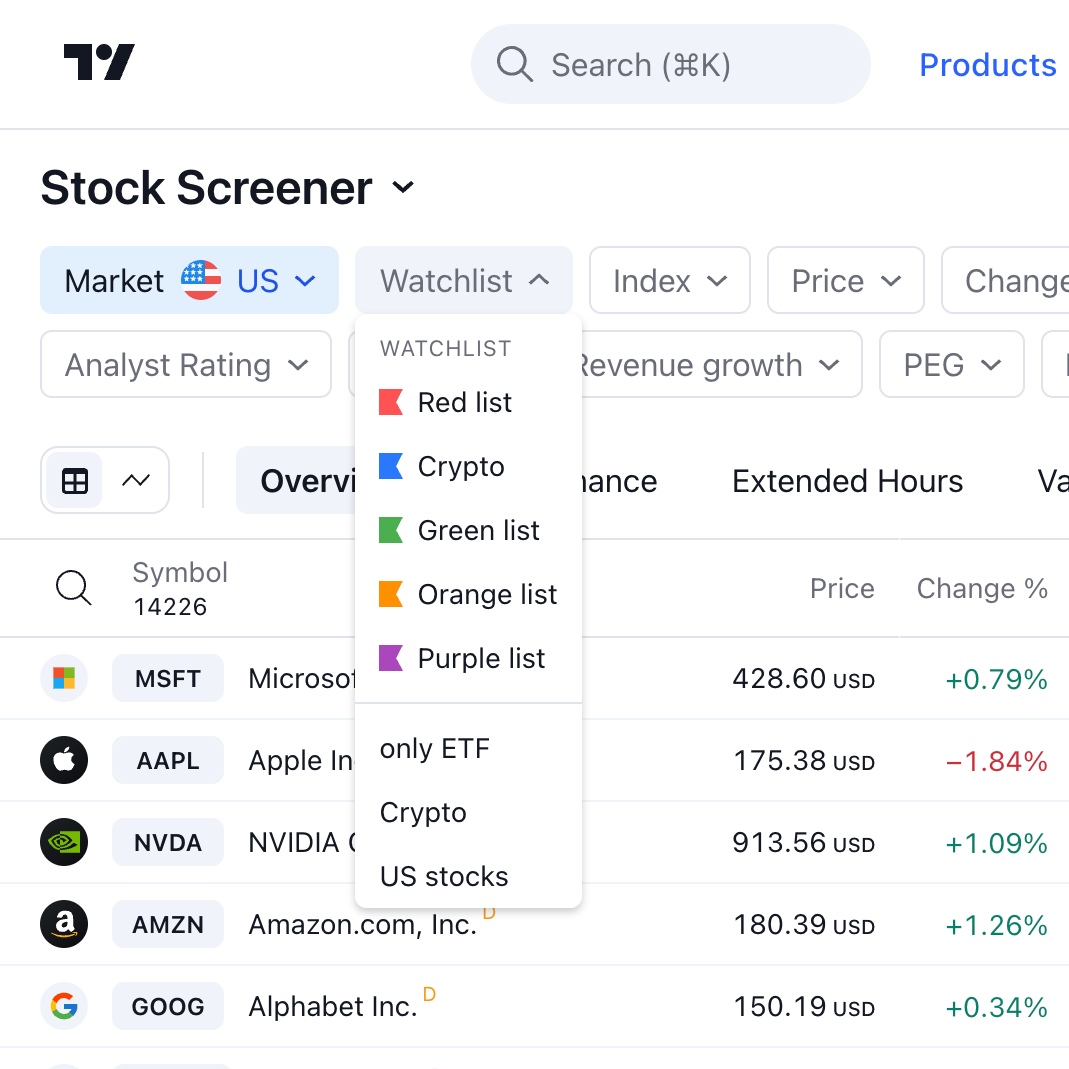
Yes, you can open and analyze charts, draw on them, and use indicators completely anonymously. However, registration (even free) is required if you want to save your Watchlist, chart Layouts, or set up Alerts. Without an account, all your work will disappear after you close the tab.