
Token Terminal: The Unfiltered Financials of Crypto Projects
Token Terminal turns blockchain data into financial reports. Learn how to analyze DeFi projects and cryptocurrencies using key metrics.
2025-09-02
Authorization is required only to use the service «Team energy»
Enter the e-mail you provided during registration and we will send you instructions on how to reset your password.
An error occurred while processing your request. Please try again later. If the problem persists, please contact our support team.
A breakdown of DefiLlama: TVL, liquidity dynamics, stablecoin distribution, and chain analytics. How to read data and understand DeFi trends.
A token’s price and its market cap only show exchange movement; they don’t reflect where users actually deposit assets. DefiLlama, the largest aggregator of decentralized finance data, is the right tool for this task.
With DefiLlama you can:
DefiLlama shows where real assets are concentrated. This tool helps analyze the resilience of networks and protocols and becomes the next step after CoinMarketCap and CoinGecko for those who want a deeper understanding of crypto project liquidity.
DefiLlama is an independent platform fully dedicated to DeFi projects. Unlike CoinMarketCap, it isn’t limited to tracking prices. The main goal of the defi llama aggregator is to show real liquidity and the total volume of assets that users have locked in smart contracts.
How the DefiLlama aggregator works:
The service is valued for honest data and complete independence from exchanges and funds. Analysts and media such as Messari, Binance Research, and CoinDesk rely on DefiLlama’s data. Thanks to this, the defi llama ranking is considered one of the most accurate in the industry.
TVL (Total Value Locked) shows how much capital users hold in the smart contracts of a specific protocol or network. This metric indicates how in-demand a project is and how much market participants trust it.
What tvl defi is is best seen in the amount of liquidity users deposit into a protocol. The more assets remain in smart contracts, the higher the trust in the project and the more resilient its economy.
A cryptocurrency’s TVL reflects interest in the ecosystem and shows how actively tokens are used within DeFi. This metric helps reveal where activity is truly concentrated and where chart numbers aren’t backed by user actions.
When TVL changes
What the size of TVL depends on
For an objective analysis, it’s worth considering not only the dollar equivalent, but also the quantity of the tokens locked. On DefiLlama these data are available for almost all protocols where statistics are open to users.
In the updated DefiLlama, the main screen is now the Home section, which replaced the old Overview. This page shows the total TVL across the entire DeFi market. The interface is simple, the data update almost instantly, so even a beginner can figure it out.
To understand how to read tvl and use these data for analysis, it’s enough to open the platform’s main tabs.
Main sections on DefiLlama
Thanks to its thoughtful structure, DefiLlama is easy to use even for complex analysis. A user immediately sees which networks are developing faster, which protocols are growing, and where liquidity is leaving.
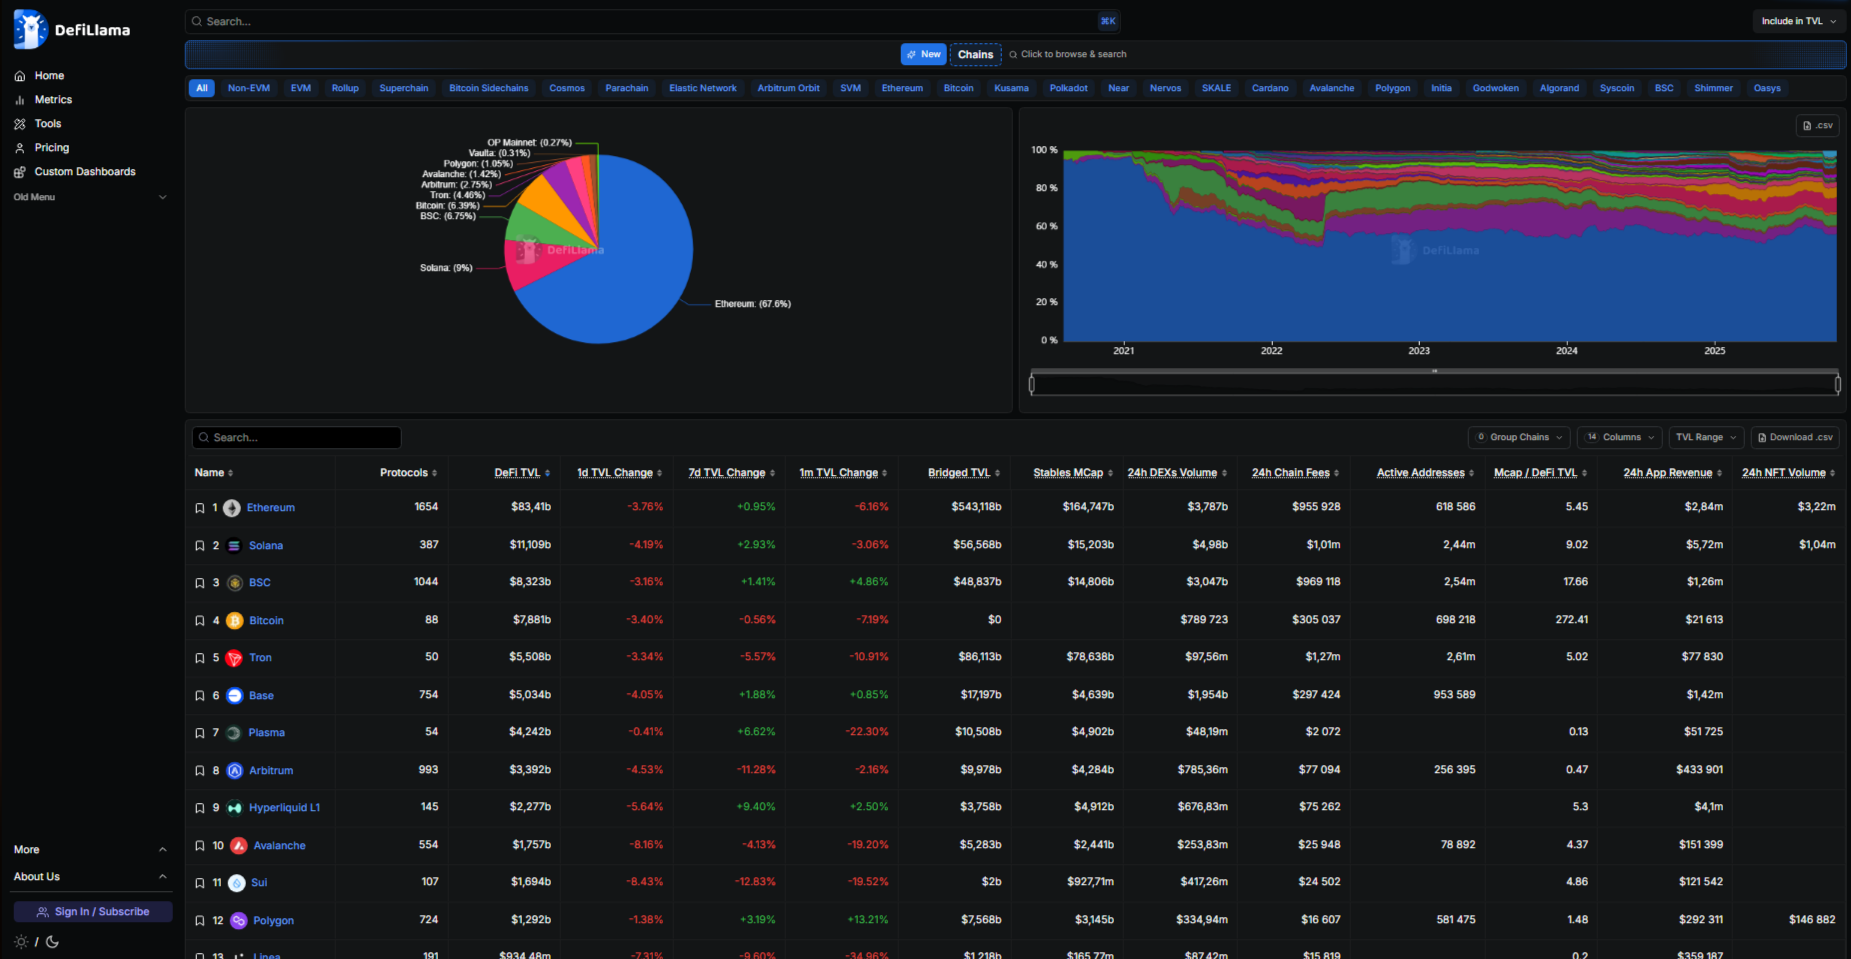
The tvl defi metric helps you understand how large and resilient a project is. It shows user trust and the amount of liquidity they are willing to keep inside a protocol. But to draw the right conclusions, a single TVL value isn’t enough. It gives a real picture only together with other data, especially when you factor in trading volume.
Key ratios to watch
This ratio is considered the best indicator of a project’s viability and reflects defi liquidity analysis in action. By regularly monitoring these data, you can quickly determine which protocols are developing and which are losing activity.
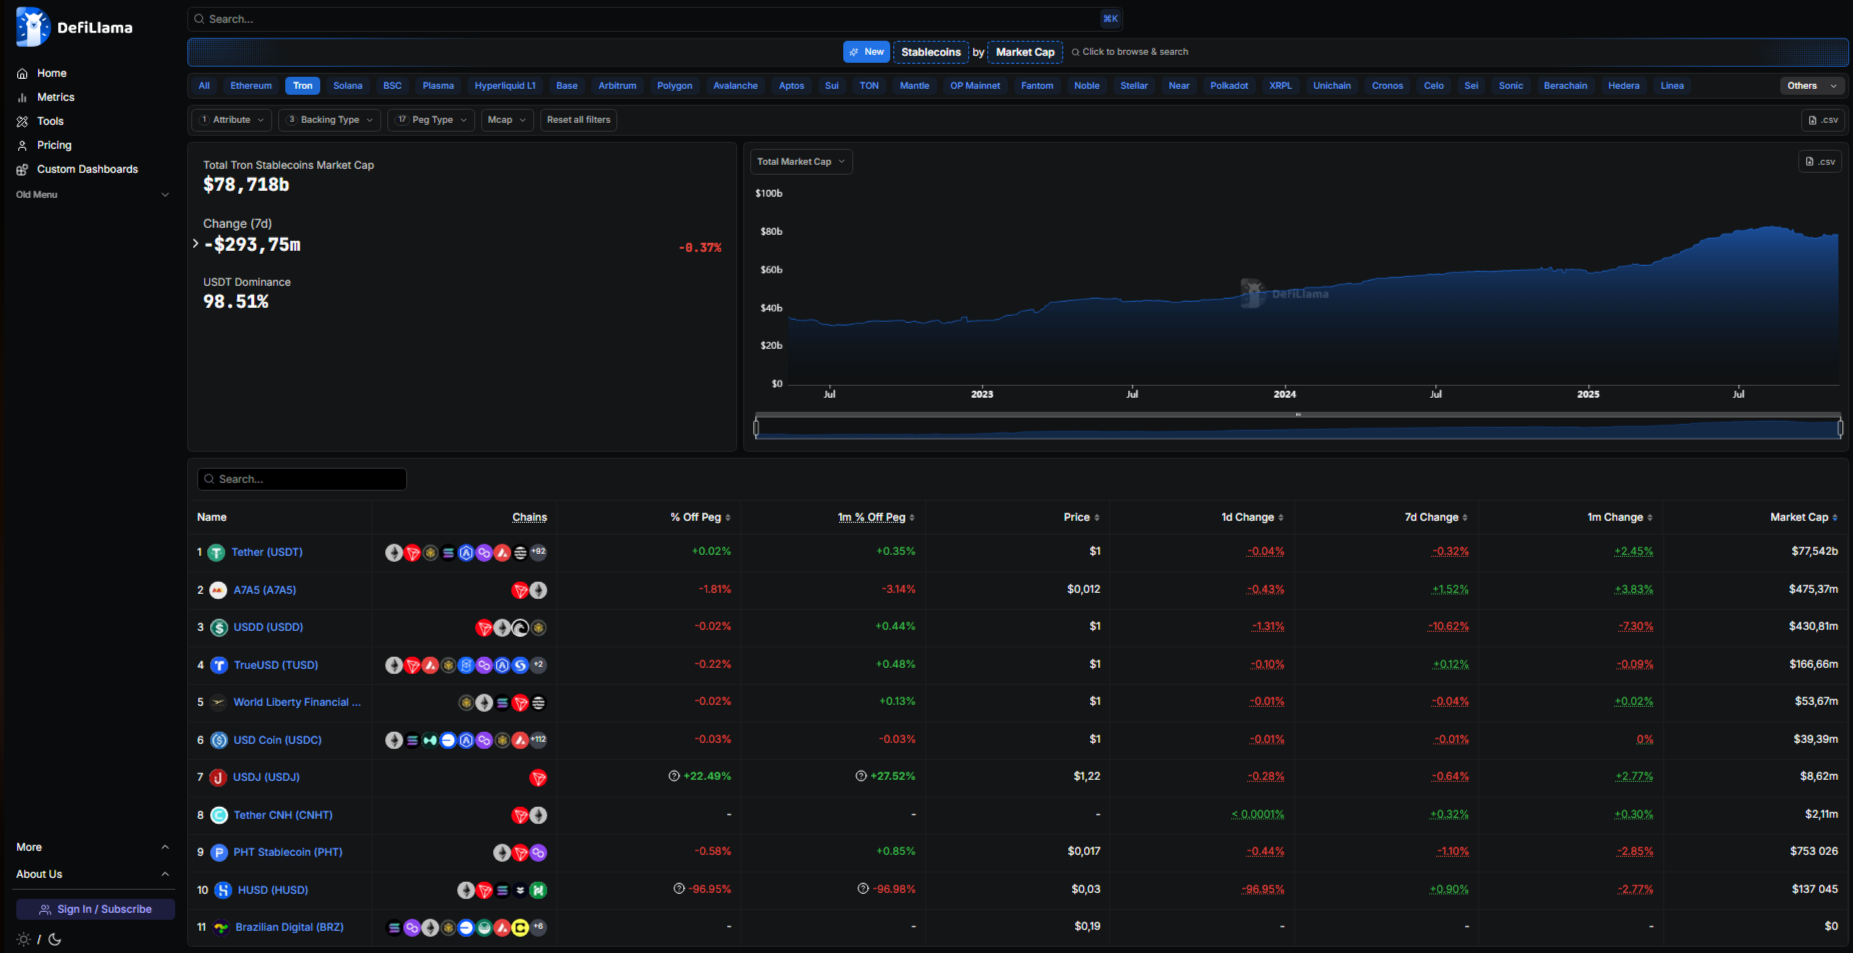
Many beginners skip the TVL Stablecoins section, which is a big mistake because it’s one of the most revealing dashboards on DefiLlama. It shows not just the total market cap of stablecoins, but their real distribution across networks.
Here you can see USDT’s dominance and the growing popularity of USDC or DAI. More importantly, you can filter the data by a specific stablecoin or network.
If you look at the distribution of USDT, you’ll immediately see that the TRON network is the absolute leader by the volume of USDT TRC-20 in circulation. This, by the way, makes TRON’s TVL particularly resilient, since a significant share of its liquidity is backed not by volatile tokens but by stable dollars.
These data confirm that today TRON is one of the main networks for settlements, transfers, and working with USDT TRC-20 defi.
Active work with DeFi and USDT TRC-20 on the TRON network requires Energy and Bandwidth resources. To avoid burning TRX on every transaction, you can use Tron Pool Energy.
Want to know how much you’ve already spent on fees? Use the expense calculator and evaluate how cost-effective it is to use Tron energy.
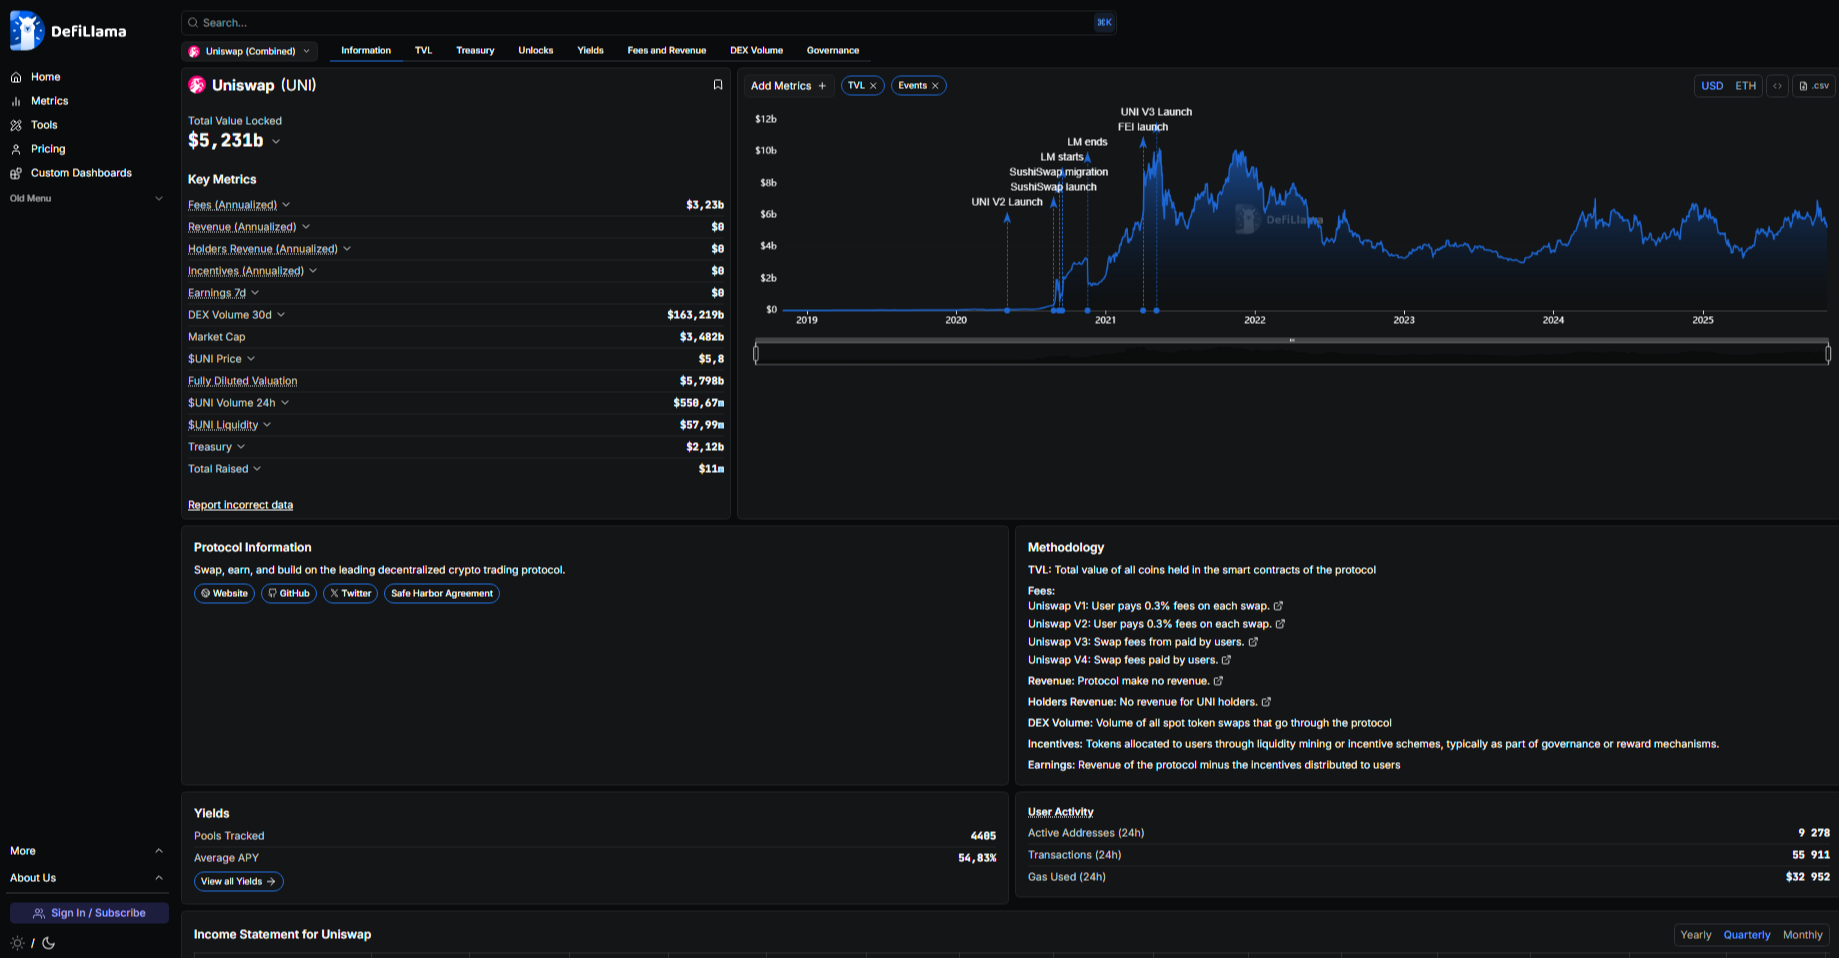
DefiLlama helps you study specific projects and compare them with each other. The data search is straightforward, so any user can figure it out. To understand where to view tvl and how to quickly assess a protocol’s state, take a few steps.
How to analyze a project on DefiLlama
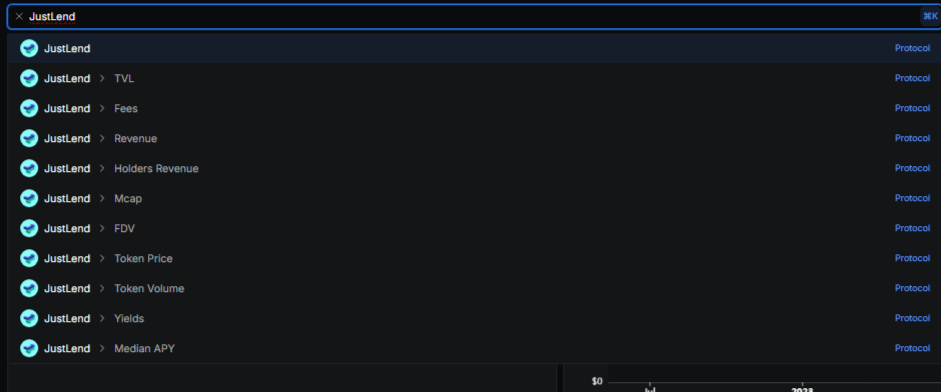
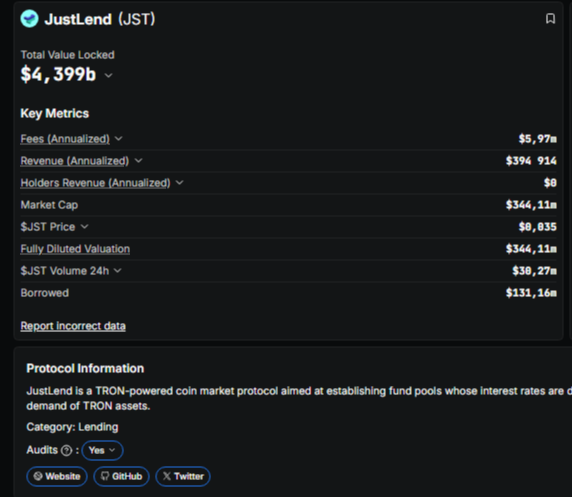
2. Open the project page and review the key metrics.
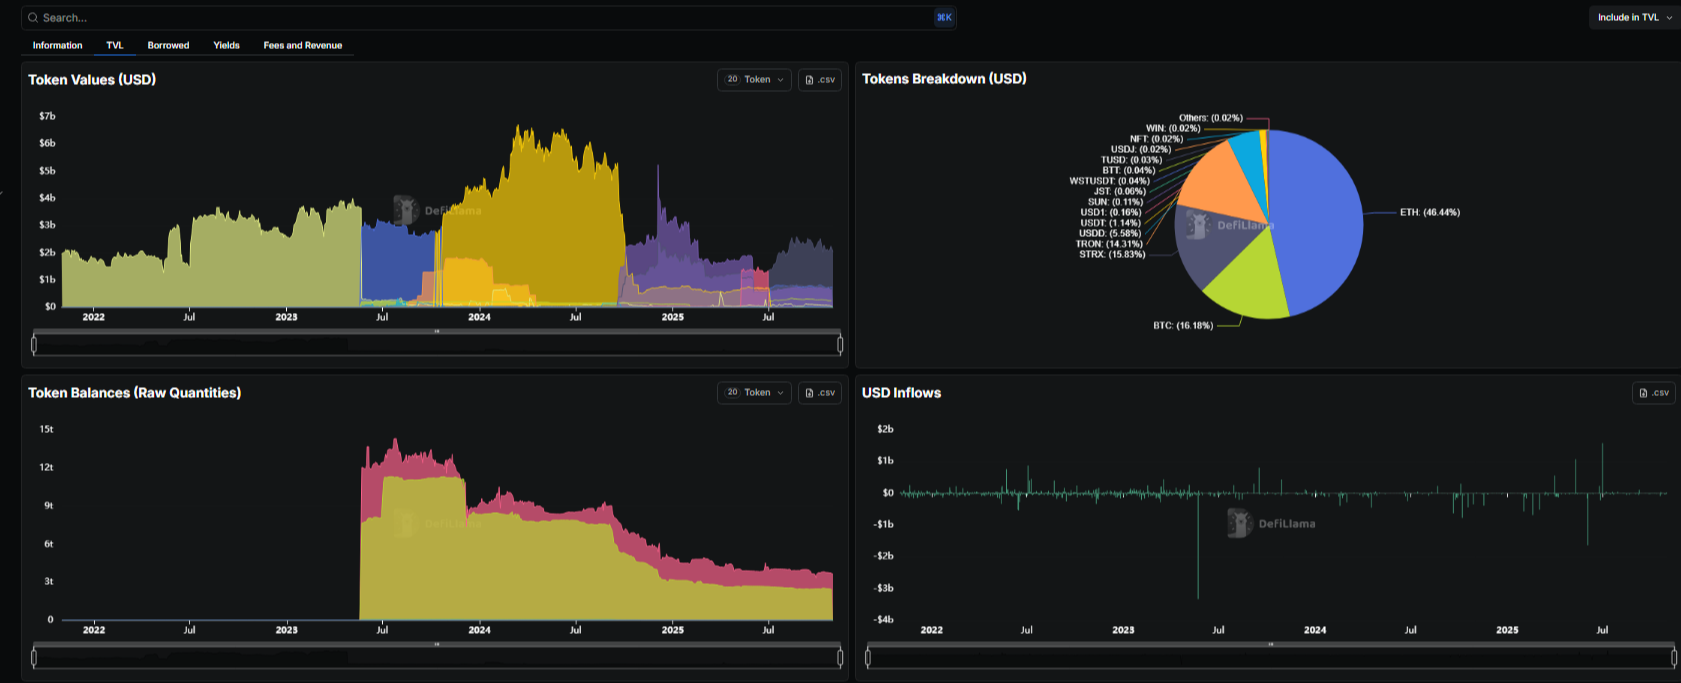
3. The TVL chart shows whether liquidity is growing or staying flat.

4. The Deposits section reflects how much capital users are actually depositing and withdrawing.
5. If the project operates on multiple networks, note where the main TVL is recorded.
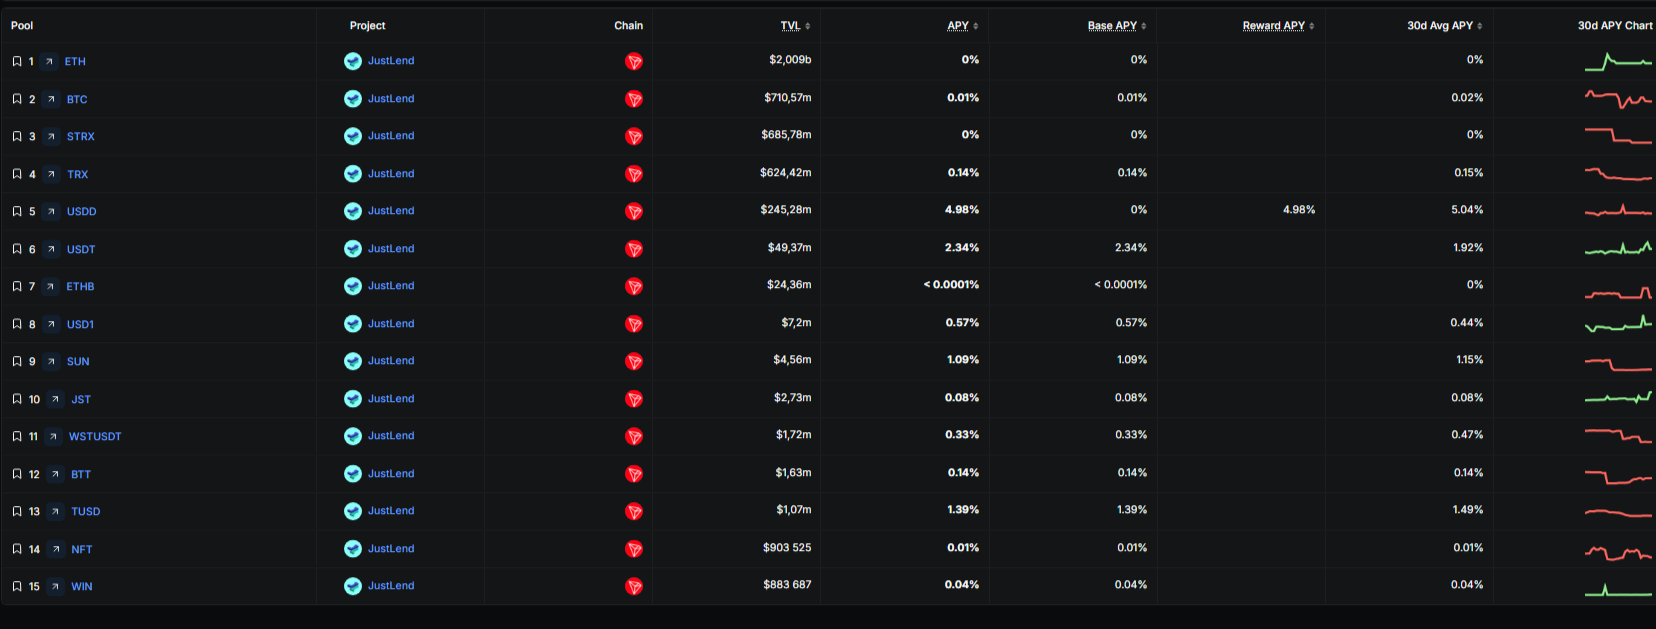
6. The column with the percentage change shows how liquidity has changed over the week.
7. In the Compare tab you can match a protocol against competitors — for example, compare JustLend TVL and Aave to see the difference in scale and dynamics.
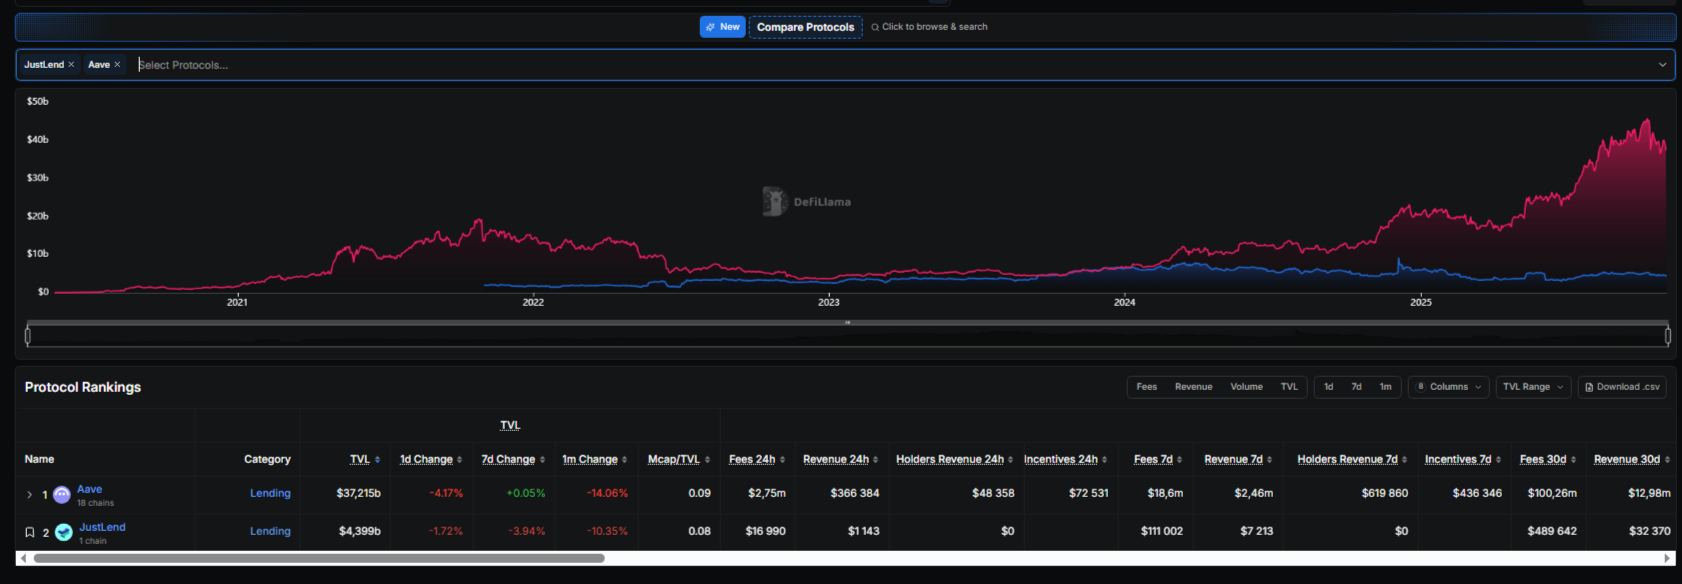
This approach lets you quickly identify which projects are growing and which are losing activity. DefiLlama makes this process simple and visual, so even complex data are easy to digest.
Any defi analytics 2025 is built on observing where liquidity moves. DefiLlama helps you see these flows and understand which networks and protocols are currently developing faster than others.
Tools that show capital movement
These data help you gauge market sentiment. If TVL is rising while trading volumes are declining, capital is likely waiting for new events. When both parameters rise simultaneously, it signals real demand and an active market phase.
The TVL metric provides useful information about a project’s condition, but it doesn’t show the whole picture. When working with DefiLlama, you should consider several limitations to avoid hasty conclusions.
What to pay attention to when evaluating TVL
A cryptocurrency’s TVL remains an important indicator, but it should be considered together with other metrics. Comparing it with trading volumes, user activity, and protocol revenue yields a more accurate picture of a project’s real state.
DefiLlama has become a truly useful tool for those who want to understand the market more deeply than simple price watching on CoinMarketCap allows. The platform shows accurate on-chain data and helps reveal where assets actually are within the ecosystem.
The TVL metric is considered one of the main signs of resilience and trust in a DeFi protocol. It shows liquidity concentration and helps spot trends when capital moves from one network to another or from project to project.
Using DefiLlama together with CoinMarketCap and CoinGecko lets you see the full market picture. This approach reveals not only market capitalization, but also the real movement and utilization of assets within DeFi.
It’s the sum of assets that users have locked in smart contracts. The higher the TVL, the more money is actually working inside protocols and the higher the trust in projects.
Open the site and choose the needed tab — Chains for networks or Protocols for projects. Look where liquidity is higher and how it changes over time.
A liquid project has a rising TVL and increasing trading volumes. That means users not only deposit funds but actively use them.
TVL rises when users add assets or when token prices increase. It falls if liquidity is withdrawn or the market dips.
It’s the distribution of liquidity across blockchains. On DefiLlama you can see which networks concentrate the main assets.
On DefiLlama, open the Stablecoins tab and select TRON or USDT. There you can see how much liquidity the network has and what share is USDT TRC-20.
Go to the Trending Protocols section. It shows protocols with the fastest TVL growth over recent days.
Use the Tron Pool Energy service. It lets you pay for network resources more cheaply and save up to 65% on each transaction.